iGenomics Alignment Tutorial
Aspyn Palatnick,
Bin Zhou,
Elodie Ghedin &
Michael Schatz
iGenomics can be used to identify genetic mutations from raw DNA sequencing data. In this example, we will walk through the steps needed to determine the source of an infection for someone showing flu-like symptoms. Of course, the app cannot directly measure DNA sequences, so you will have to first isolate the DNA (or reverse transcribe the RNA) and sequence it using a DNA sequencer such as from Illumina, Ion Torrent, PacBio, or Oxford Nanopore.
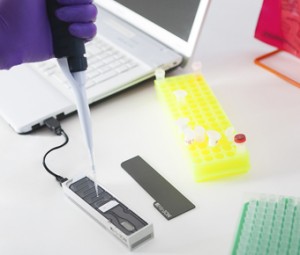
0. Sequence your sample
You will need to sequence your sample using one of the available DNA sequencers. Shown here is the MinION sequencer from Oxford Nanopore that connects to a laptop via USB. There are also petabytes of public data available in different archives around the world, including the NCBI Sequence Read Archive (SRA).
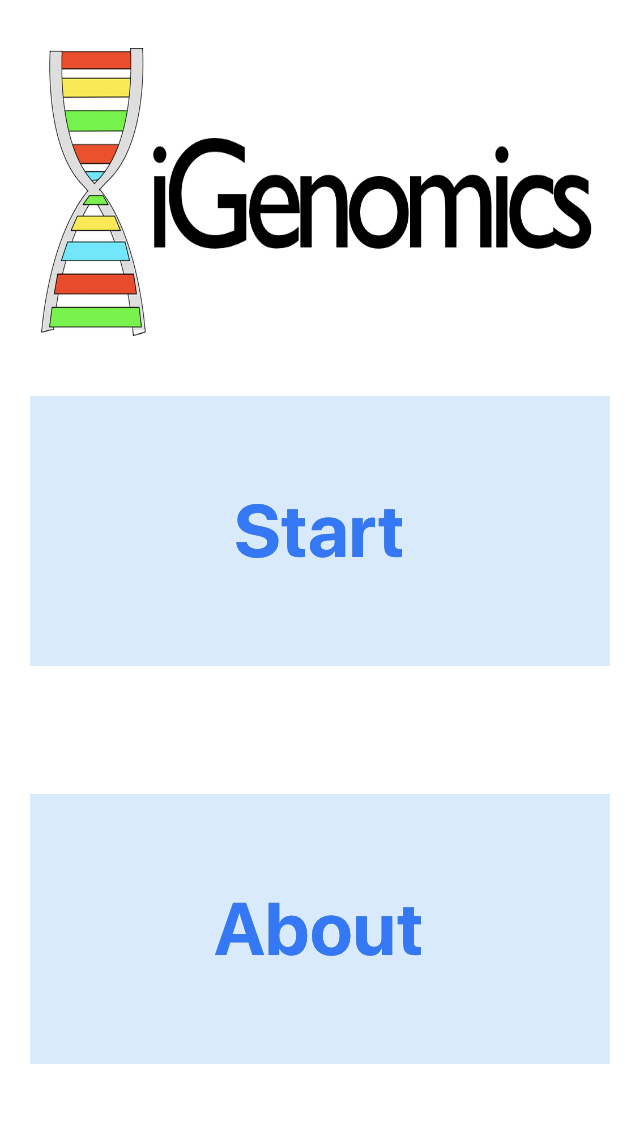
1. Launch the app and press Start to begin.
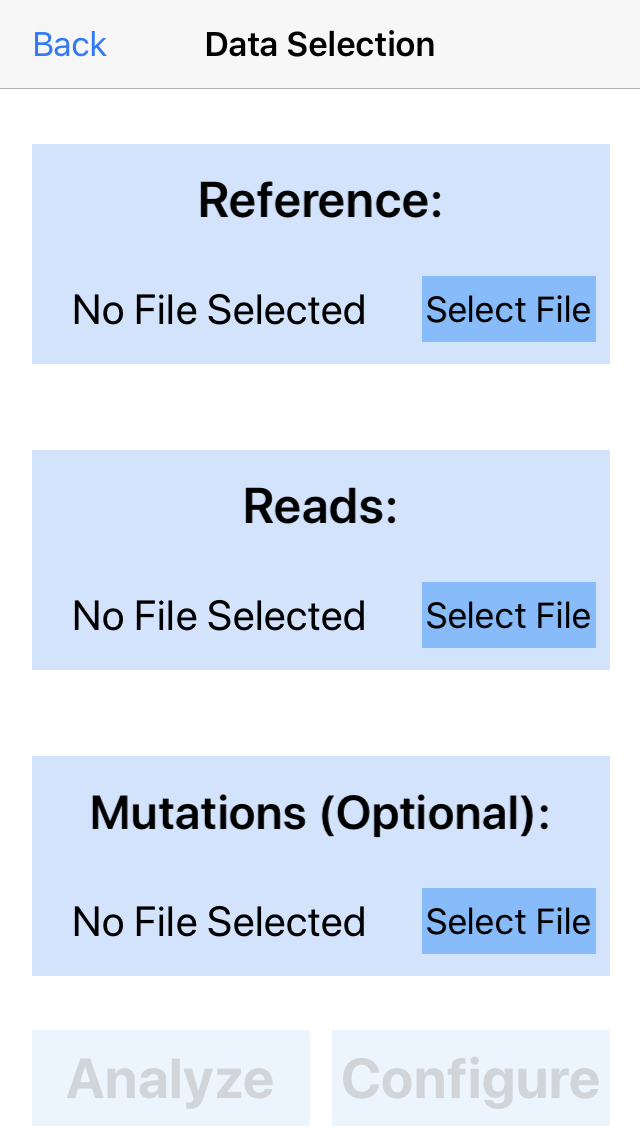
2. Select data.
Select the reference genome, DNA sequences (reads), and, optionally, an important mutations file. Press select file in the reference section to get started.
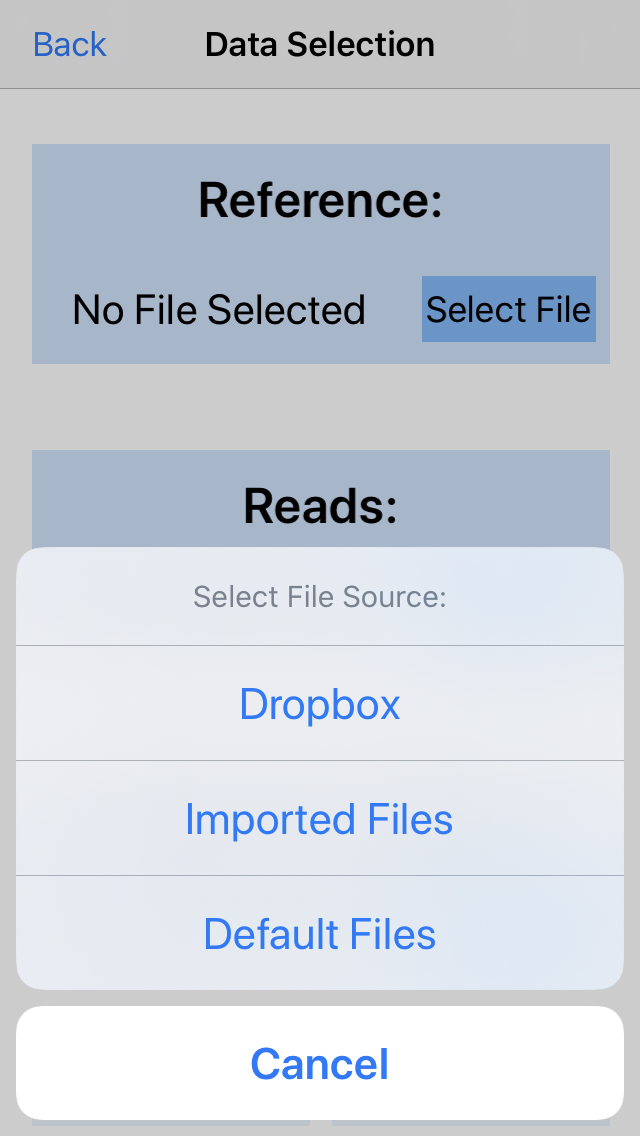
3. Choose data source
Import new files from Dropbox, browse files you've already imported to iGenomics, or choose a default (simulated) file. For this example, we choose a simulated file.
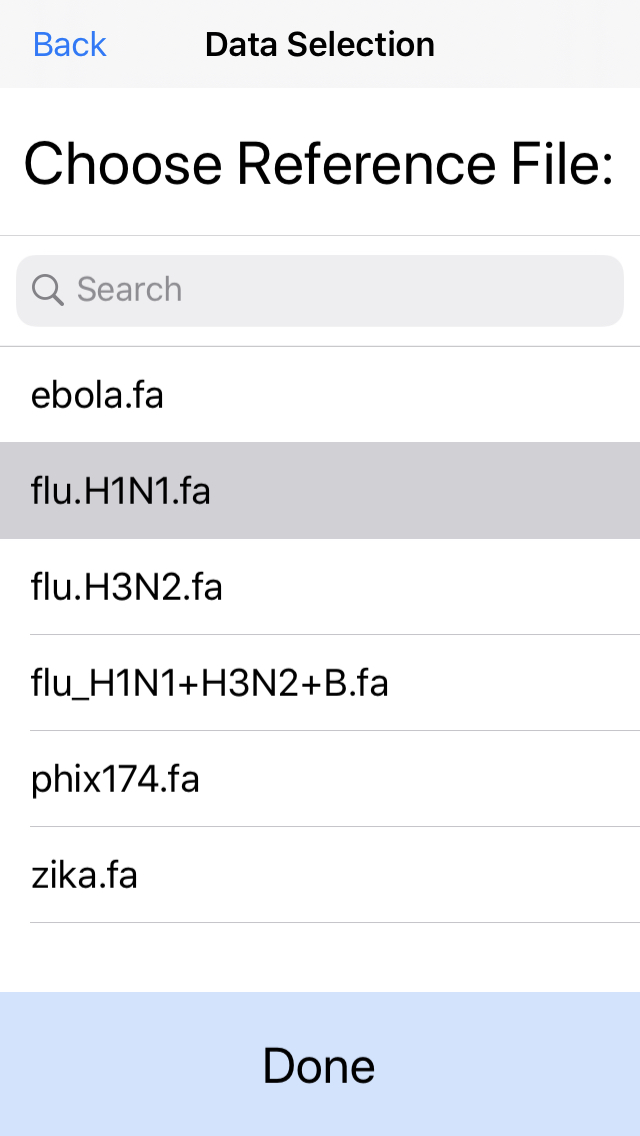
4. Select the reference genome.
In this example, pick the H1N1 flu reference genome. For best performance, we recommend genome files less than 1Mbp.
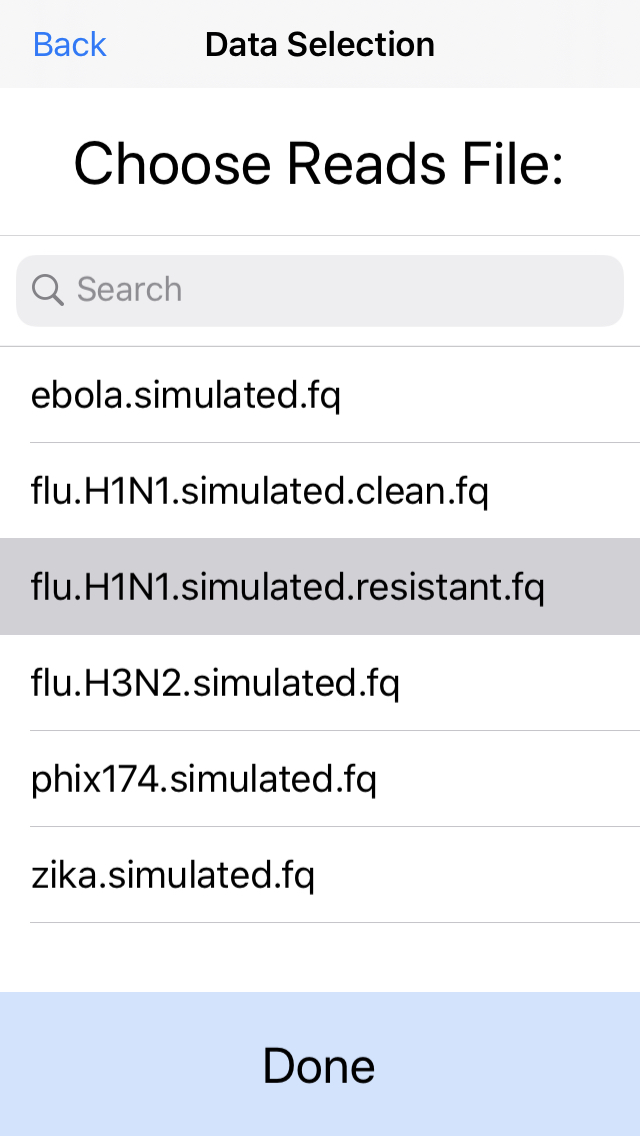
5. Select the DNA sequences (reads) to analyze.
This can be a fastq file from any platform (Illumina, Ion Torrent, PacBio, Oxford Nanopore, etc). Here we will select simulated reads from the H1N1 flu strain. For best performance we recommend aligning at most 50Mbp of sequence data.
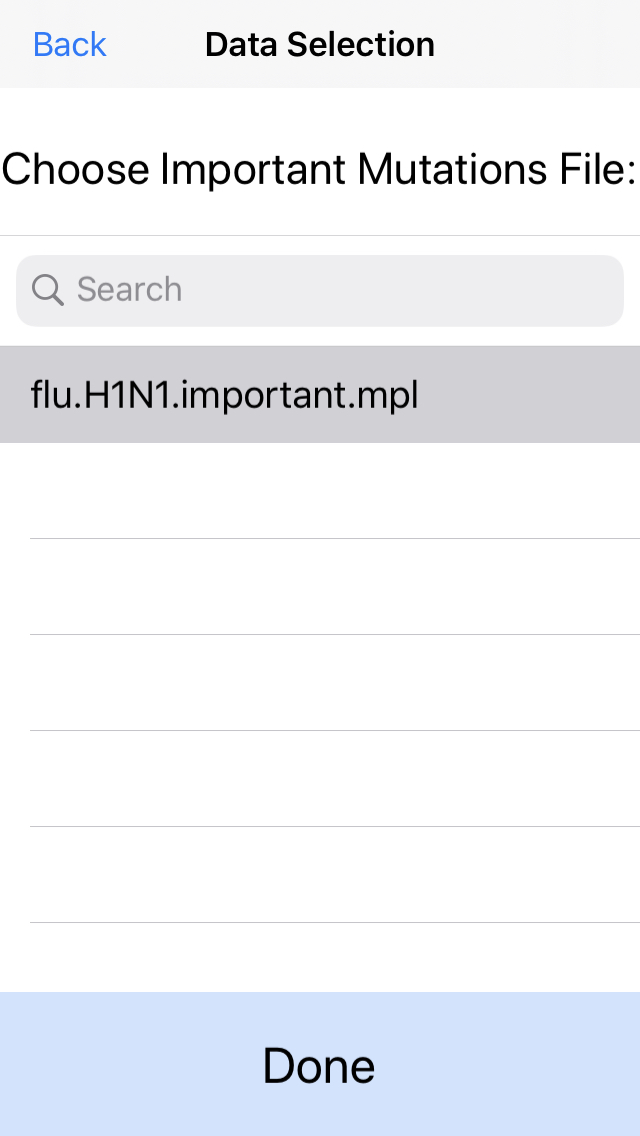
6. Optionally select the known important mutations.
In this example, we will load an important mutations file (mpl) containing the position of several SNPs relevant for flu antiviral treatments. If you do not have a predefined list of mutations, click next without selecting any files.
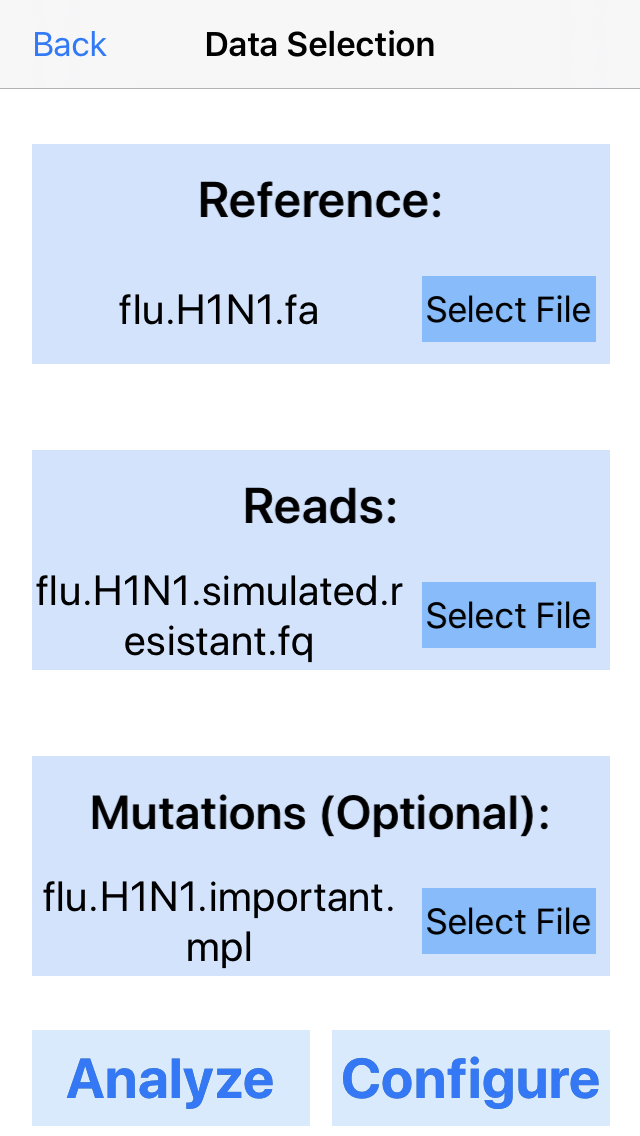
7. Finish selecting data.
At this point, if you've been following the example, your data selection page should look like the above. Next, press Configure.
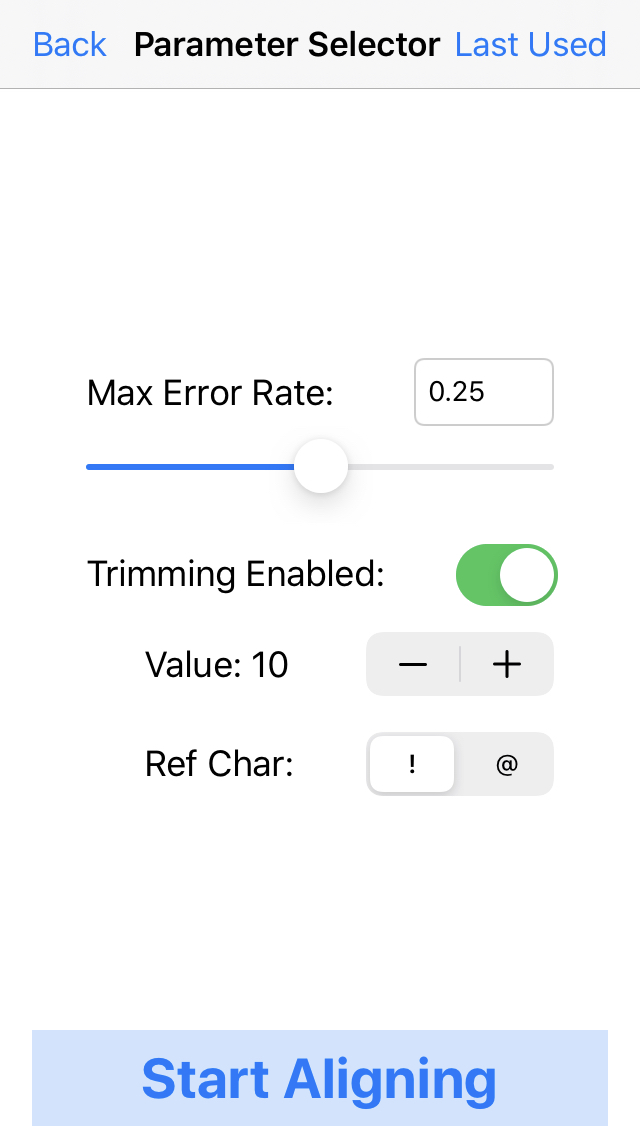
8. Select the parameters for mapping the reads.
For these data, choose a max error rate of 0.25 and enable trimming with a value of 10, and trimming ref char as "!". This will trim off low quality bases at the ends of the read (below QV 10), and map the reads with 0.25 being the max allowed fraction of mutations (insertions/deletions/substitutions) relative to read length for an alignment to occur.
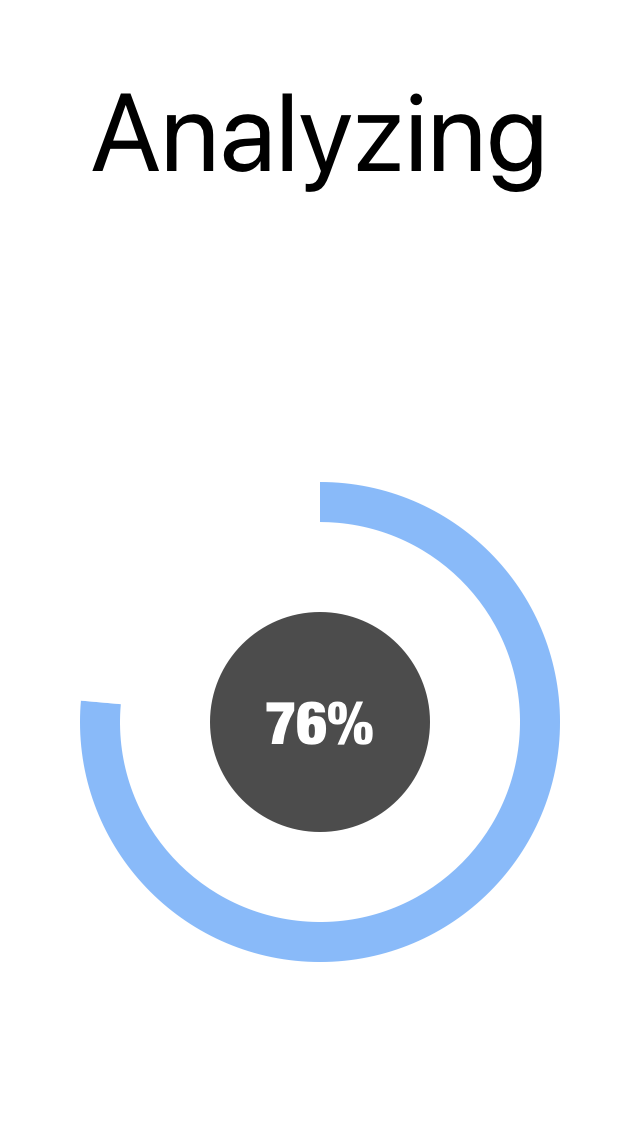
9. The progress circle will show the percent of reads that have been processed.
In this example, it will take 1 - 2 seconds to align the 5428 flu reads to the reference.
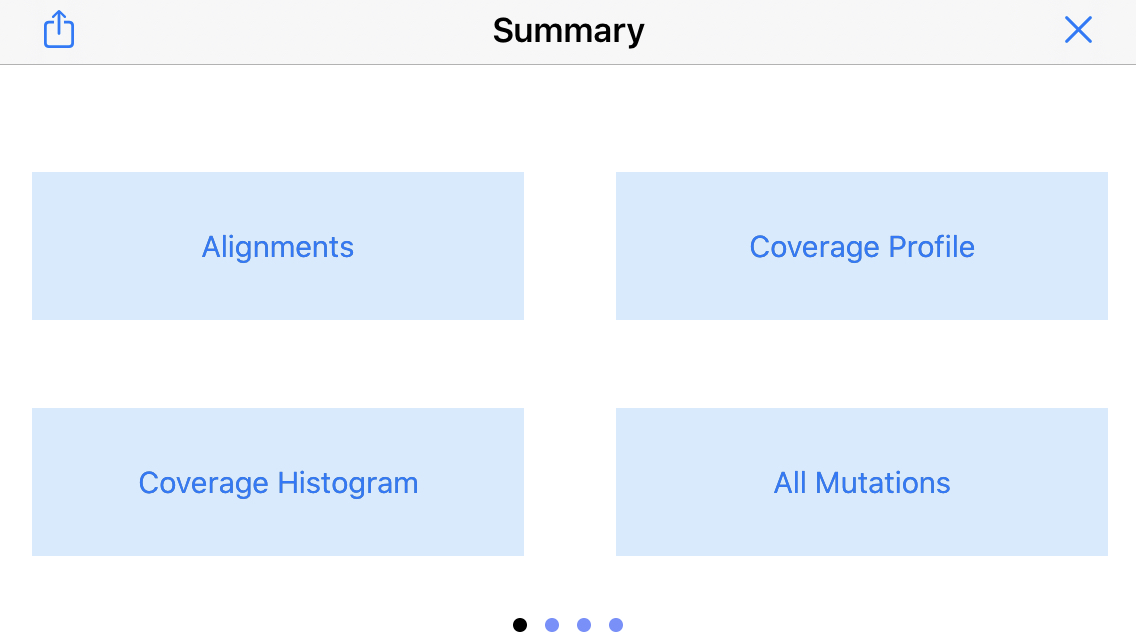
10. The next view is a menu of available analysis modes.
Click the "Alignments" button to display the individual read alignments.
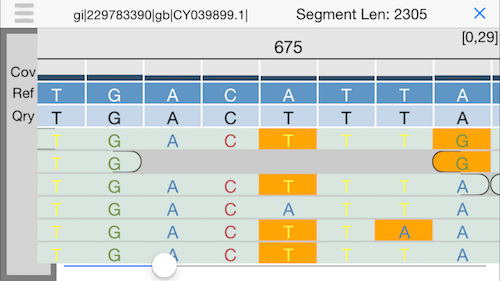
11. Alignment view
This will display an IGV-like interface with the individual reads aligned to the reference. Use the slider at the bottom or drag your finger to explore.
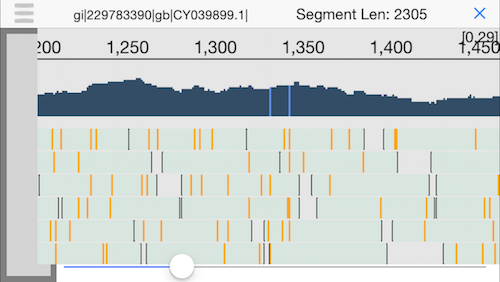
12. Semantic zooming
Pinching the display will zoom out to show the coverage across the genome and highlight any positions with a mutation. Since we have good coverage across the H1N1 flu reference genome, we can be quite sure this person was infected by the flu.
13. Return to the summary screen
Clicking the icon in the top left corner (three little horizontal bars) will return to the summary menu.
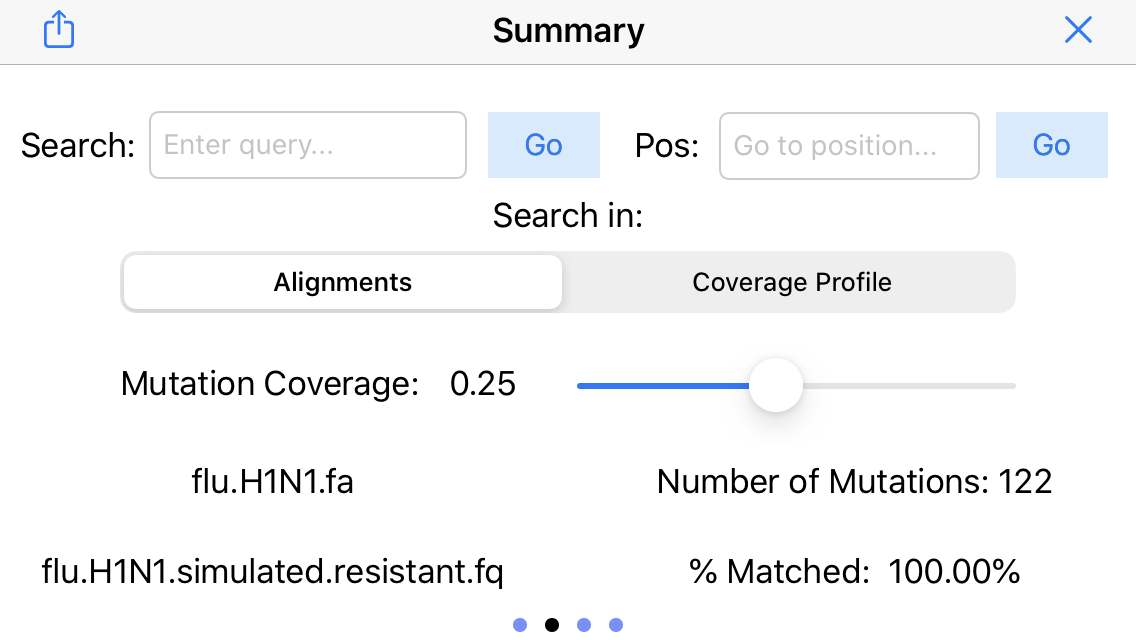
14. Display mapping statistics
Swipe to the right to display the other menus. Here we see a summary of the mapping rate (100% of the reads mapped) and the number of identified mutatations (122 SNPs). Use the mutation coverage slider to set the fraction of conflicting reads needed to identify a mutation.
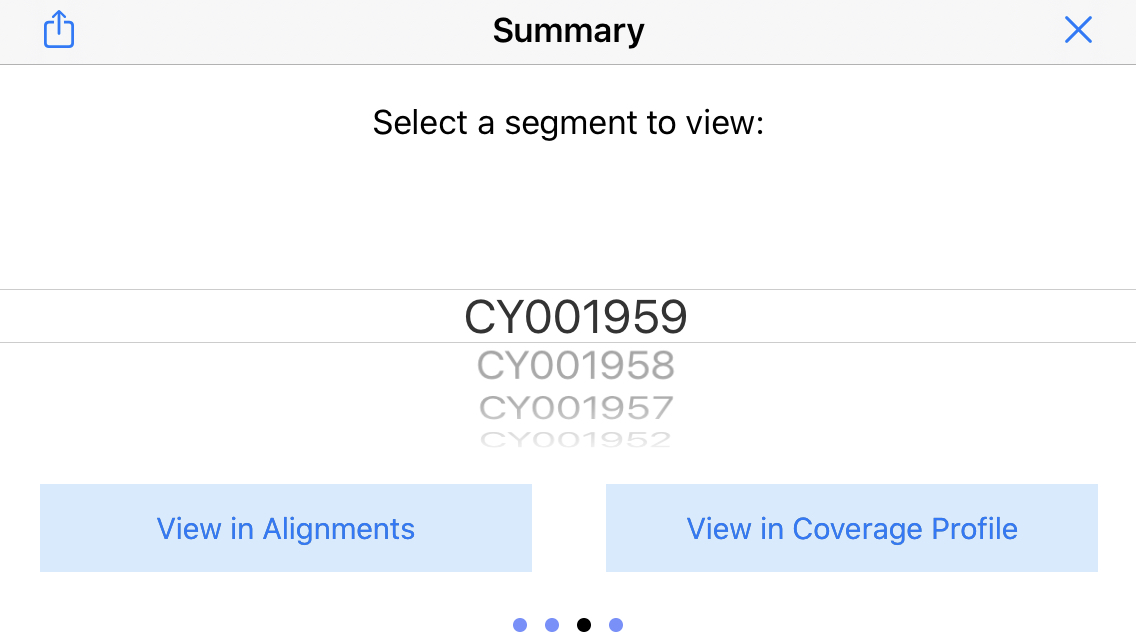
15. Display the sequence picker
Swipe again to the right to bring up the "sequence picker" which lets you jump to different sequences in the reference genome. In this example, this will jump the display to the different segments of the flu genome.
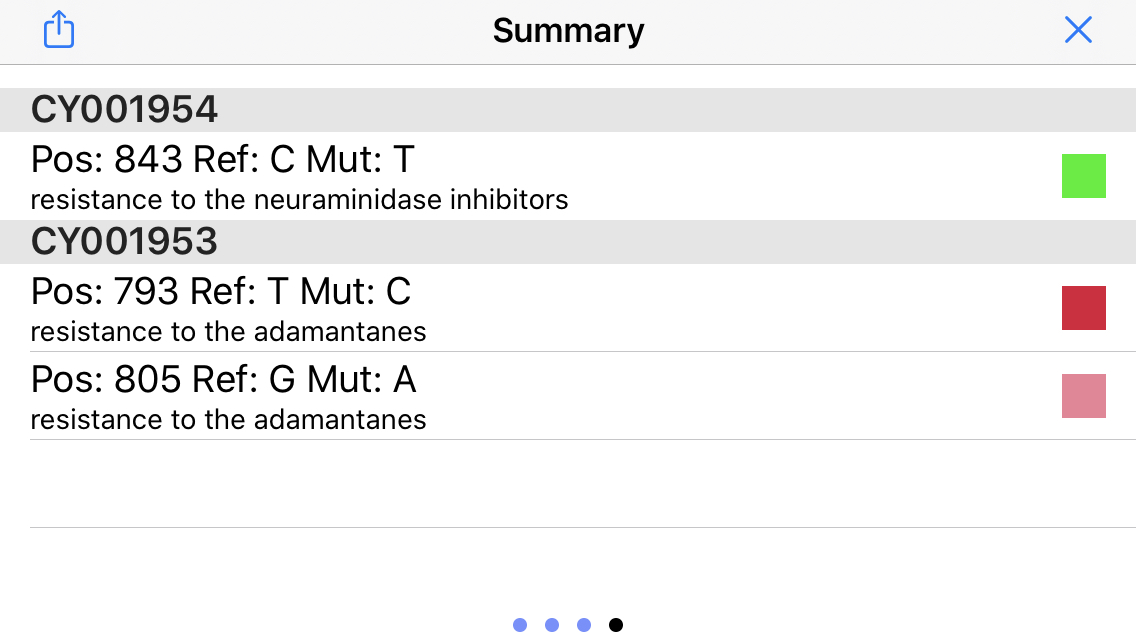
16. Display Mutation Status
Swipe again to the right to display the status of the important mutations (see above). In this example, the virus has a homozygous and a heterozygous mutation that infers resistance to the adamantanes, but no mutations associated with neuraminidase inhibitors!
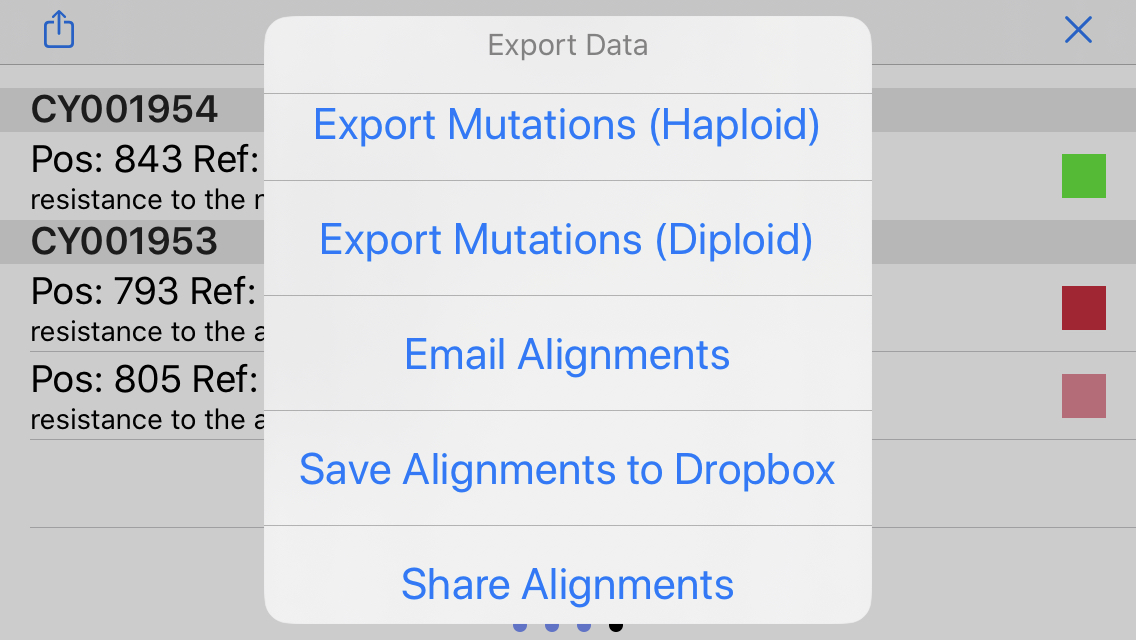
17. Export results
Click the icon in the top left to bring up a menu to export the results via email, Dropbox, or other apps (Airdrop, Google Drive, etc.) by pressing Share. For example, you can email the antiviral screening results to your primary care provider!
Links
|